Porting Cycle-Based CPU Usage to ARM64
In this post I will share my story porting System Informer’s cycle-based CPU usage to ARM64. I’ll explain the difference in CPU cycle tracking on Windows ARM64, compare time-based vs cycle-based measurements, and describe how System Informer calculates and displays this information.
Cycle-Based CPU Usage
Let’s start with some background on the topic.
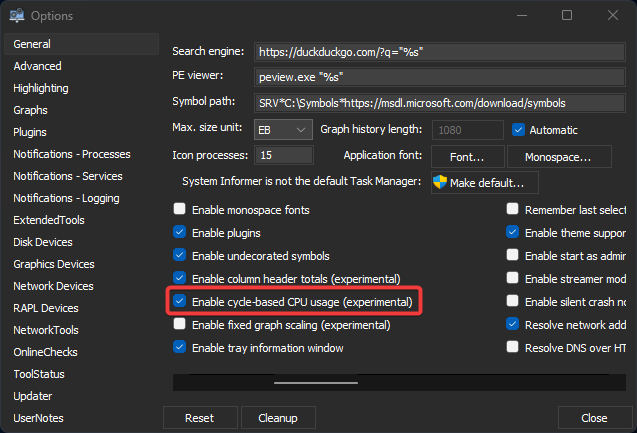
System Informer has a feature, enabled by default for most architectures, named “cycle-based CPU usage”. You can enable or disable this in the options menu. Enabling this feature calculates the CPU usage based on the number of CPU cycles reported by the OS for each thread. When disabled, the CPU usage is calculated using a time-based method. The time-based calculation leverages properties tracked by the OS for how much processor time a thread uses in both kernel and user contexts. Other task management or monitoring tools use one of these or other information streams to track, monitor, and/or display the CPU usage of threads and processes running on the system. Relying only on a time-based calculation loses context and can report inaccurate CPU utilization above or below certain thresholds. So the cycle-based CPU usage calculation in System Informer plays an important role in accurately displaying CPU utilization.
Clock cycles are retrieved from the processor by reading from a model specific
register (MSR). For x86/x64 this is done via the rdtsc instruction. For ARM
this is done by reading the PMCCNTR register. ARM actually has multiple
counters in this area, namely CNTVCT. That said, PMCCNTR is aptly named
“Performance Monitors Cycle Count Register”, so it seems fit for purpose.
Depending on the kernel, user mode may not be permitted to read from these
registers directly. For Windows, both PMCCNTR and CNTVCT are accessible at
EL0 (the lowest software execution privilege, aka user mode). An aside, EL0
means “exception level zero” and increases as privilege does (more info
here). This is inverted numbering from “rings”, ring 0 being the most
privileged and ring 3 being least. It makes sense to increment the number as
privilege increases, less we end up with something awkward like ring -1… I’m
digressing, sorry.
Windows has tracking for cycle and processor times in the kernel in a few
places. But what’s relevant to us is the tracking in the KTHREAD and
KPROCESS. You can retrieve this information by using ProcessTimes,
ProcessCycleTime, ThreadTimes, and ThreadCycleTime via
NtQueryInformationProcess and NtQueryInformationThread.
struct _KTHREAD
{
    // ...
    volatile ULONGLONG CycleTime;
    // ...
    union
    {
        // ...
        struct
        {
            UCHAR SchedulerApcFill2[4];
            ULONG KernelTime;
        };
        // ...
        struct
        {
            UCHAR SchedulerApcFill5[83];
            UCHAR CallbackNestingLevel;
            ULONG UserTime;
        };
    };
    // ...
};

struct _KPROCESS
{
    // ...
    ULONGLONG CycleTime;
    // ...
    ULONG KernelTime;
    ULONG UserTime;
    // ...
};

// NtQueryInformationProcess + ProcessTimes
// NtQueryInformationThread + ThreadTimes
typedef struct _KERNEL_USER_TIMES
{
    LARGE_INTEGER CreateTime;
    LARGE_INTEGER ExitTime;
    LARGE_INTEGER KernelTime;
    LARGE_INTEGER UserTime;
} KERNEL_USER_TIMES, *PKERNEL_USER_TIMES;

// NtQueryInformationProcess + ProcessCycleTime
typedef struct _PROCESS_CYCLE_TIME_INFORMATION
{
    ULONGLONG AccumulatedCycles;
    ULONGLONG CurrentCycleCount;
} PROCESS_CYCLE_TIME_INFORMATION, *PPROCESS_CYCLE_TIME_INFORMATION;

// NtQueryInformationThread + ThreadCycleTime
typedef struct _THREAD_CYCLE_TIME_INFORMATION
{
    ULONGLONG AccumulatedCycles;
    ULONGLONG CurrentCycleCount;
} THREAD_CYCLE_TIME_INFORMATION, *PTHREAD_CYCLE_TIME_INFORMATION;
Retrieving the cycle time information for idle threads on the system involves a
call to NtQuerySystemInformation or NtQuerySystemInformationEx using
SystemProcessorIdleCycleTimeInformation. The Ex query information call may
target a processor group. I won’t be going into processor groups here, we’ll
leave that topic for another post. But I will say that System Informer is
“processor group aware”. It must be since Windows thread scheduling recently
changed causing threads to schedule across processor groups. And this caused
some interesting behavior in the application. But again, we’ll table that topic
for a followup post.
// NtQuerySystemInformation + SystemProcessorIdleCycleTimeInformation
// NtQuerySystemInformationEx + SystemProcessorIdleCycleTimeInformation + ProcessorGroup
typedef struct _SYSTEM_PROCESSOR_IDLE_CYCLE_TIME_INFORMATION
{
    ULONGLONG CycleTime;
} SYSTEM_PROCESSOR_IDLE_CYCLE_TIME_INFORMATION, *PSYSTEM_PROCESSOR_IDLE_CYCLE_TIME_INFORMATION;
System Informer actually gets most of this information from
SYSTEM_PROCESS_INFORMATION via NtQuerySystemInformation. We walk the
information returned from this call to calculate CPU usage, among other things.
struct _SYSTEM_PROCESS_INFORMATION
{
    ULONG NextEntryOffset;
    ULONG NumberOfThreads;
    // ...
    ULONGLONG CycleTime;
    // ...
    LARGE_INTEGER UserTime;
    LARGE_INTEGER KernelTime;
    // ...
    SYSTEM_THREAD_INFORMATION Threads[1]; // SystemProcessInformation
    // SYSTEM_EXTENDED_THREAD_INFORMATION Threads[1]; // SystemExtendedProcessinformation
    // SYSTEM_EXTENDED_THREAD_INFORMATION + SYSTEM_PROCESS_INFORMATION_EXTENSION // SystemFullProcessInformation
};

struct _SYSTEM_THREAD_INFORMATION
{
    LARGE_INTEGER KernelTime;
    LARGE_INTEGER UserTime;
    // ...
};
Whenever a timer interrupt happens the kernel does accounting for UserTime and
KernelTime in KiUpdateRunTime. For a thread to be charged with the time
increment it is dependent on a given thread executing on the processor at the
time of the interrupt. The kernel charges the current thread and process during
this interrupt based on the previous mode of execution. If the previous mode is
UserMode it charges UserTime otherwise it charges KernelTime. There are
two other time accounting items in this path DpcTime and InterruptTime.
Accounting for these are dependent on interrupt levels and whether a DPC
(deferred procedure call) is active. You can see this code in the Windows
Research Kernel inside KeUpdateRunTime.
Cycle times are updated more frequently. Updates to process and thread cycles
occurs when interrupts happen or any time processor execution transitions
between threads. The kernel associates each processor with a structure in the
kernel (the KPRCB). The KPRCB contains StartCycles which holds the state
of the cycle counter since it last fetched the cycle count. When the kernel is
ready to charge the executing thread with the number of cycles it took, the
kernel will subtract the StartCycles from the current cycle count (read from
the MSR mentioned previously) and add this value to the CycleTime in the
KTHREAD and KPROCESS accordingly. After this, it stores the cycle count it
just read from the MSR in StartCycles in preparation to charge the next thread
to execute. This makes a cycle-based CPU calculation more accurate to the amount
of “effort” any given thread and process is taking from the CPU.
struct _KPRCB
{
    // ...
    struct _KTHREAD* CurrentThread;
    struct _KTHREAD* NextThread;
    struct _KTHREAD* IdleThread;
    // ...
    ULONGLONG StartCycles;
    ULONGLONG TaggedCyclesStart;
    ULONGLONG TaggedCycles[3];
    volatile ULONGLONG CycleTime;
    ULONGLONG AffinitizedCycles;
    ULONGLONG ImportantCycles;
    ULONGLONG UnimportantCycles;
    ULONGLONG ReadyQueueExpectedRunTime;
    volatile ULONG HighCycleTime;
    ULONGLONG Cycles[4][2];
    // ...
};
Notice how an IdleThread is directly “pinned” to a KPRCB. In other words
there is a one to one relationship between idle threads and the number of
processors. CurrentThread is the thread currently executing on that processor
and NextThread is the next thread to execute on that processor, otherwise
a thread is selected from the dispatcher ready queues. If there are none to
execute the IdleThread is used.
The implementation in System Informer for measuring CPU utilization is
independent of when System Informer is scheduled to execute. This is done by
tracking a delta between two points in time as an external observer to the
activity. For cycle-based CPU usage System Informer uses an aggregation of the
cycles by all threads on the system to calculate a relative usage by each
thread/process compared to the total. In order for this to be accurate it must
know the cycle count for the idle threads. And this idle cycle count must be
representative of the number of cycles “not doing anything”. In order to retain
the breakdown by user and kernel for each thread, it uses the time-based
information to distribute the thread cycles between kernel and user. The logic
for time-based CPU usage is very similar but only relies on KernelTime and
UserTime. However, previously stated, some accuracy is lost in comparison to
cycle-based since time-bases is not a function of the “effort” a thread/process
is taking from the CPU.
Cycle-Based ARM64 Usage
Okay, so this feature should just work on ARM64, right… right? Wrong, and looking back at what I worked through, it’s obvious.
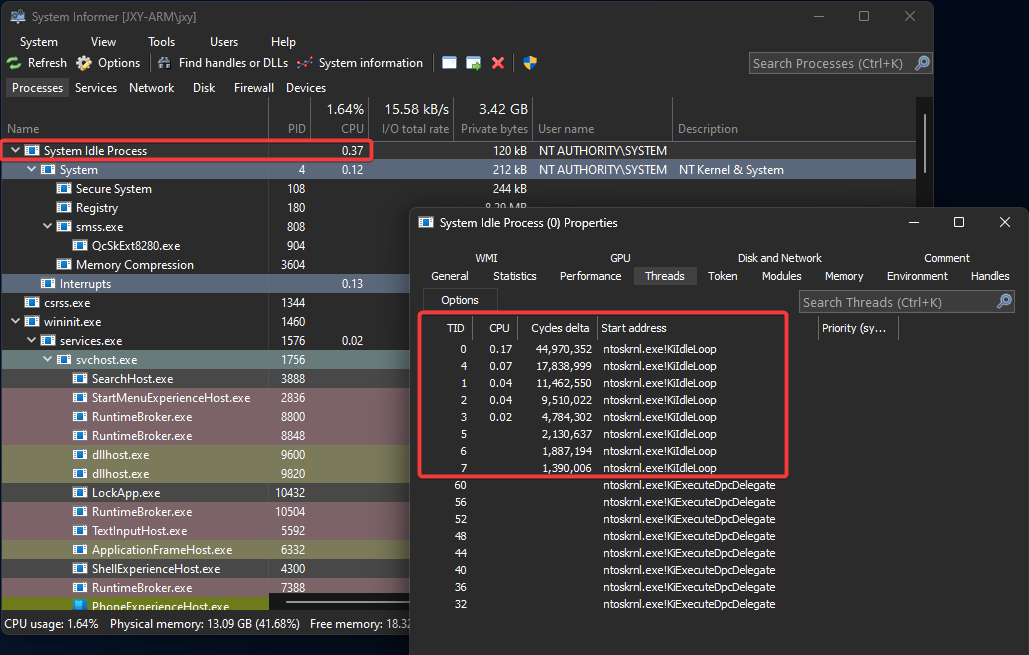
Enabling cycle-based CPU usage on a native ARM64 System Informer build immediately showed me there was a problem. The idle process CPU usage was way lower than I would expect and other process CPU utilization was way too high. After some debugging I identified that the idle threads cycle count was way too low. Remember, this value needs accounted for when accumulating the total cycles overall. This aggregation of cycles is used in the relative calculation for each other process’ threads on the system. The kernel was reporting cycle times for the idle threads that were not representative of how many cycles should have been used “not doing anything”. This effectively means the “missing” idle cycles were being attributed to each other thread on the system. Which explained why other threads CPU utilization was higher than it should have been.
For brevity, I won’t be going into detail on how thread scheduling works on
Windows, I described it at a high level earlier. But all we need to know is when
a processor has no work to do the kernel selects the idle thread which executes
KiIdleLoop. As it turns out, the implementation for KiIdleLoop on ARM64, at
first glance, looks just like any other architecture. It fetches the cycle count
for tracking and calls into the hardware abstraction layer to idle the processor
(HalProcessorIdle). Well, here’s how ARM64 is different.
One of the keystone features of the ARM architecture is the ability to
transition into low-power states. This is done by instructing the processor
to enter this mode by executing the wait-for-interrupt (WFI) or wait-for-event
(WFE) instruction. We can confirm this by looking at HalProcessorIdle:
ntoskrnl!HalProcessorIdle:
00000001`4048fbf0 d503237f pacibsp
00000001`4048fbf4 a9bf7bfd stp         fp,lr,[sp,#-0x10]!
00000001`4048fbf8 910003fd mov         fp,sp
00000001`4048fbfc 940013df bl          ntoskrnl!HalpTimerResetProfileAdjustment (00000001`40494b78)
00000001`4048fc00 d5033f9f dsb         sy
00000001`4048fc04 d503207f wfi
00000001`4048fc08 a8c17bfd ldp         fp,lr,[sp],#0x10
00000001`4048fc0c d50323ff autibsp
00000001`4048fc10 d65f03c0 ret
Intel x86/x64 has a similar instruction HLT. This operates similarly to WFI
in that it stops instruction execution until an enable interrupt occurs.
ntoskrnl!HalProcessorIdle:
00000001`403f5fc0 4883ec28        sub     rsp,28h
00000001`403f5fc4 e8b7f7f9ff      call    ntoskrnl!HalpTimerResetProfileAdjustment (00000001`40395780)
00000001`403f5fc9 4883c428        add     rsp,28h
00000001`403f5fcd fb              sti
00000001`403f5fce f4              hlt
00000001`403f5fcf c3              ret
00000001`403f5fd0 cc              int     3
00000001`403f5fd1 cc              int     3
I always knew that ARM could enter low-power states. I did not know at the time, how frequently or efficiently it does and what the consequences are of doing so are. So I went digging into the WFI documentation.
Wait for Interrupt (WFI) is a feature of the ARMv8-A architecture that puts the core in a low-power state by disabling the clocks in the core while keeping the core powered up. This reduces the power drawn to the static leakage when the core is in WFI low-power state.
Additionally from idle management:
Standby mode can be entered and exited quickly (typically in two-clock-cycles). It therefore has an almost negligible effect on the latency and responsiveness of the core.
What does this mean? Well, it means the clock is not cycling and… well then
the cycle counter is not updating? We can confirm this by looking elsewhere
in the ARM documentation and in the Windows Kernel implementation on cycle
fetching. Here is part of KiIdleLoop:
00000001`404f45a0 d53b9d0b mrs         x11,PMCCNTR_EL0    // x11 gets current cycle count
00000001`404f45a4 f947a668 ldr         x8,[x19,#0xF48]    // x8 gets _KPRCB.StartCycles
00000001`404f45a8 cb08016a sub         x10,x11,x8         // x10 gets relative cycles from StartCycle to current cycle count
00000001`404f45ac f94026a9 ldr         x9,[x21,#0x48]     // x9 gets _KPRCB.IdleThread.CycleTime
00000001`404f45b0 8b0a0128 add         x8,x9,x10          // x8 gets idle thread cycle time (x9) plus cycle increment (x10)
00000001`404f45b4 f90026a8 str         x8,[x21,#0x48]     // stores new idle thread cycle time in _KPRCB.IdleThread.CycleTime
00000001`404f45b8 f907a66b str         x11,[x19,#0xF48]   // stores the last cycle time fetch in the _KPRCB.StartCycles
The kernel reads the PMCCNTR_EL0 register to fetch the cycle count which we
can look up for more information in the PMCCNTR_EL0 documentation.
All counters are subject to any changes in clock frequency, including clock stopping caused by the WFI and WFE instructions. This means that it is CONSTRAINED UNPREDICTABLE whether or not PMCCNTR_EL0 continues to increment when clocks are stopped by WFI and WFE instructions.
Aha! And there we have it. This explains why the idle thread cycle times are not being updated as I would normally expect them to be.
Is this a bug in the Windows Kernel?
No, at least, I don’t think so. The kernel is arguably doing the best accounting
here for cycle usage. The idle threads are taking less cycles and their
KTHREAD reflects this accurately. Plus, I don’t think they could even fix this
if they wanted to. There would have to be a way to know how many cycles the CPU
would have used had the clock not been disabled. It isn’t clear to me if
CNTVCT produces that. And for the purpose of performance monitoring PMCCNTR
is the counter to use, per documentation. Anyway, there is a happy accident that
comes from this in the way we’ve implemented cycle-based CPU usage in System
Informer on ARM64 - we’ll go over that shortly.
This subject is also documented by Microsoft:
All ARMv8 CPUs are required to support a cycle counter register, a 64-bit register that Windows configures to be readable at any exception level, including user mode. It can be accessed via the special PMCCNTR_EL0 register, using the MSR opcode in assembly code, or the _ReadStatusReg intrinsic in C/C++ code.
The cycle counter here is a true cycle counter, not a wall clock. The counting frequency will vary with the processor frequency. If you feel you must know the frequency of the cycle counter, you shouldn’t be using the cycle counter. Instead, you want to measure wall clock time, for which you should use QueryPerformanceCounter.
What about Intel?
Intel does have an instruction MWAIT which does something similar to WFI and
instructs the processor move into low-power states. Why does Windows use HLT
instead of MWAIT? Well probably because it isn’t supported everywhere. I
expect we will likely see Microsoft make use of features like this as 13th
Generation Intel’s Performance Hybrid Architecture become
more widely adopted.
At this time, I’m unsure if these new Intel processors and a Windows Kernel implementation leveraging these features will account for cycle times like it does for ARM. I do not have access to this type of hardware to do testing.
The Fix! Workaround? Hey… it works, and it’s kinda neat too!
So how do we calculate cycle-based CPU usage in System Informer if we don’t know how many total cycles the CPU spent idle?
There is the obvious option. Disable cycle-based CPU usage entirely on ARM and
only rely on time-based. The idle thread times are accurate still since the
threads in WFI (wait-for-interrupt) mode will transition out when the timer
interrupt occurs. This means time-based CPU utilization works fine. But, we
lose accuracy of how much “effort” the threads are taking from the CPU.
The most accurate representation of the utilization of the CPU for ARM would
show the idle process CPU usage below what is “not being used” by other
processes. Since this would indicate the idle thread being in the low-power
WFI state and not using CPU cycles.
As it turns out by applying an estimation leveraging time-based data and some boring math you can get pretty close. And, as a result, display the system idle process and threads in a way that, I think, most closely represents their CPU utilization. The implementation really opened my eyes to the power (pun intended) of ARM. At the end of this post is a link to the commit in System Informer that has the full implementation and boring math.
With cycle-based CPU usage turned on for an ARM64 build you’ll notice that the CPU usage for the idle threads is lower than what might be expected. You’re probably accustom to seeing the “System Idle Process” at (more or less) one minus the total utilization of the CPU. But I argue, and maybe you’ll agree, this is an unfair representation for ARM. The kernel, using the technology of the processor, is putting the core into the low-power state and that time spent “idle” is doing the right thing by… well… not consuming cycles! So let’s display it that way in System Informer.

The cycle-based CPU usage for ARM64 in System Informer is not enabled by default and is marked “(experimental)”. We came to the decision to do it this way since out-of-the-box it might be counter-intuitive for the average user to see the “System Idle Process” not as it is for other architectures.

So, for now, we’re going to leave it as an experimental feature, but for those reading I hope you go in and turn it on to try it out. It’s a wonderful way for showing how ARM differs from other architectures.
Conclusion
System Informer’s cycle-based CPU usage presents the idle threads for ARM64 in a way that best represents idle utilization and how the Windows operating system makes use of the processor features. I hope this has been an interesting read and keep an eye out for more System Informer engineering-focused posts in the future. Below are some references, code, and further reading on the topic.
- System Informer ARM64 Support Commit
- ARM Idle Management
- ARM Documentation WFI
- ARM Documentation PMCCNTR_EL0
- ARM Documentation CNTVCT_EL0
- MSDN ARM64 ABI Conventions
- Intel Documentation HLT
- Intel Documentation RDTSC
- Intel Documentation MWAIT
- Intel Performance Hybrid Architecture
- Linux Idle Time Management
- Linux intel_idle Driver
Update (2024-09-28)
In Windows 24H2, the Windows Kernel has been changed to do its own estimation of the idle thread cycle count, making the estimation in System Informer no longer necessary. However, this change in the kernel comes with an unfortunate side effect: the idle cycle accounting now reflects the cycles spent in the low-power state. This means the kernel does not directly expose the cycles spent by the idle threads actually doing work. As such, System Informer can no longer account for the idle process threads in a way most representative of the actual utilization of ARM processors. The choice by the Windows Kernel team appears to be a trade-off between accuracy and consistent representation across architectures. It would seem as though they’re opting for consistency between different architectures over accuracy of idle cycle accounting.
Cycle Accounting Changes in the Windows Kernel
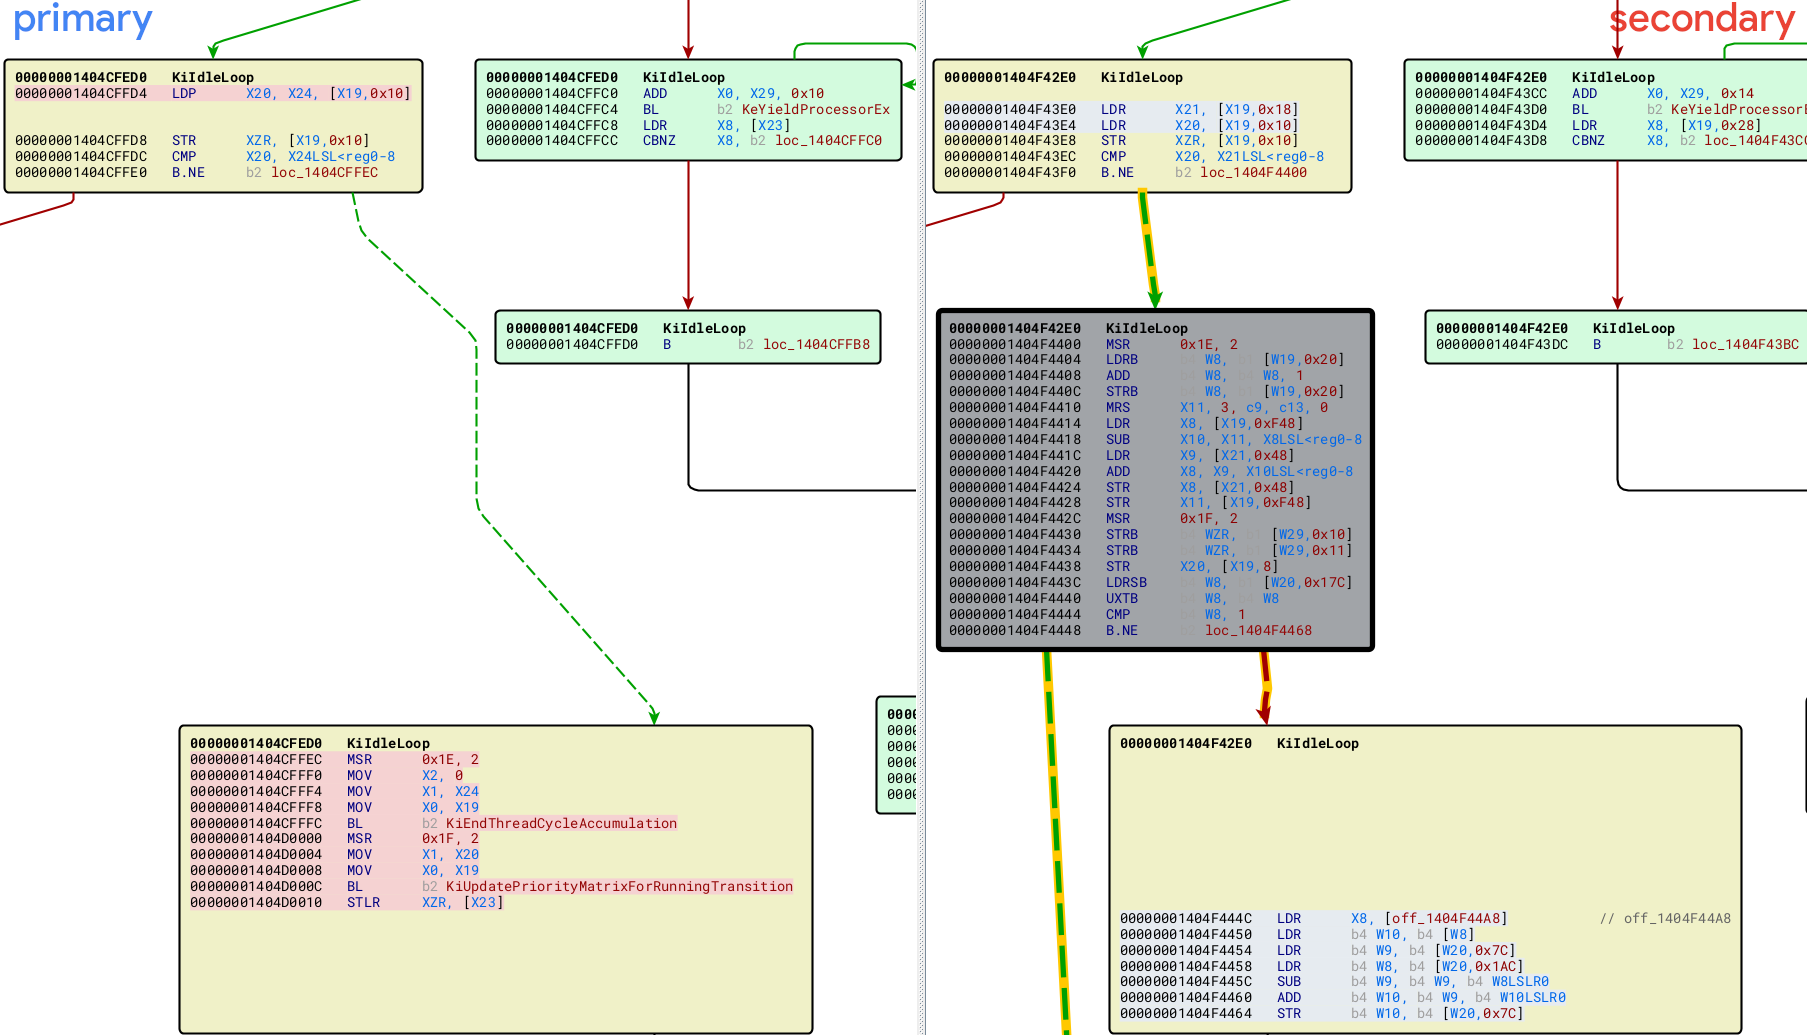
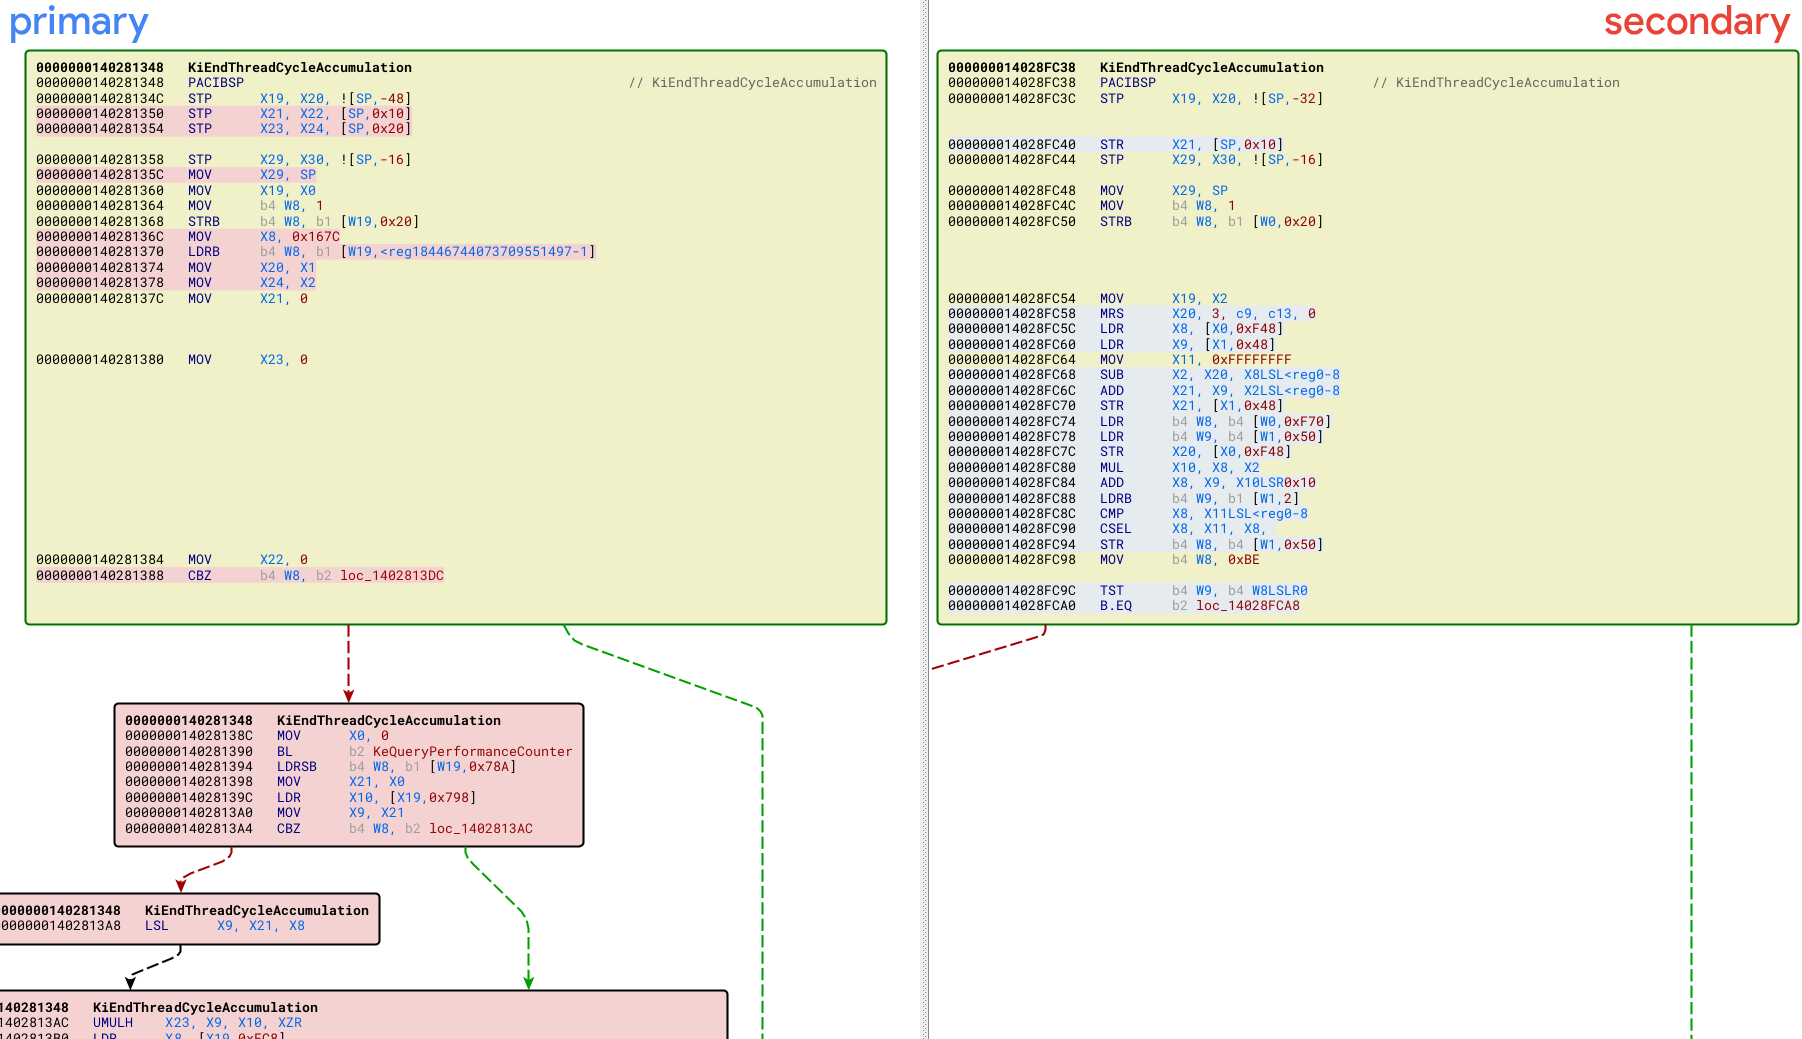
Below are diffs of the Windows kernel between 23H2 and 24H2 that show the changes, “Primary” is 24H2 and “Secondary” is 23H2.


The MRS X11, 3, x9, x13, 0 above is another way of representing
mrs x11,PMCCNTR_EL0, which was removed between 23H2 and 24H2. Now the kernel
chooses to do accounting for cycles using KeQueryPerformanceCounter instead
of reading PMCCNTR_EL0. This change is significant because all cycle
accounting across the entire system for all processes now uses
KeQueryPerformanceCounter, which broadly results in different accounting than
PMCCNTR_EL0.
The Windows Kernel has also defined and uses some features flags on this subject, indicating that Microsoft themselves are still sorting out how to best to expose cycle accounting for ARM.

Changes to System Informer
Due to the broad accounting changes in the kernel and the existence of feature
flags indicating that Microsoft is still working on this, System Informer is
keeping the cycle-based CPU usage feature as experimental for ARM64. When
running on a 24H2 build of Windows with the experimental cycle-based CPU usage
enabled, System Informer skips the now unnecessary work
to adjust for the use of PCMMNTR_EL0, and instead uses the kernel’s accounting
as it would on other architectures. The consequence of this is that the idle
process and its threads now reflect the CPU usage and cycles spent in the
low-power state. In other words, the idle threads are now generally one minus
the CPU utilization of all other threads, as you might expect on other
architectures. Previously, with the kernel accounting for cycles using
PMCCNTR_EL0, the idle threads would reflect only the effort taken by the CPU
to execute them.